
Introduction
The so called “Next Generation” sequencing technologies are a cheaper replacement of Sanger-based sequencing. The data have lower overall quality but are more easy to obtain. Notably, by design one avoids cloning of the sample DNA into a plasmid vector, amplification of the vector in a bacterium, isolation of the amplified plasmid vector DNA finally followed by sequencing of the unknown insert in the plasmid. One does not need to fiddle with electroporator, bacterial culture, do colony picking, plasmid DNA isolation. The idea is pleasing but there are some consequences. Notably, one looses the advantage to filter away partial sample DNA inserts, removal of contaminating DNA incl. adapters/primers, salts, enzyme traces used in previous steps of the experimental procedure. All of these used to get effectively removed when bacteria amplified the plasmid vector and just lost the other unwanted stuff along their way while growing and dividing. That was the good part of the old school work.
Nowadays we sacrificed the quality of the input material for the ease of work and if possible, we do the least steps. The lab process obviously still uses polymerase chain reaction to copy the template DNA but now there are several steps (not just one like before) where PCR is used and where errors not only arise and cumulate but also can be inadverently selectively increased. The sample is sometimes a precious result of e.g. low-abundant RNA isolation followed by reverse-transcription. The cDNA products are fragmented and end-repaired, eventually a ligase is used to add terminal oligonucleotides specific to the sequencing machine. Any artifacts happening in these steps easily propagate into latter work because cleanup procedures are limited. As already mentioned in the past we got rid of some artifacts due to the fact that they were not compatible during plasmid ligation or were just diluted and lost because of their size or other physical properties. Bacteria also effectively/precisely copied the sample insert for us whereas now we need PCR to amplify the sample but at much higher error rate. We use plenty of primers and adapters in todays techniques but their trace removals are not performed at all or with too low efficiency. In contrary, their removal was 100% efficient because the bacteria degraded or diluted all crap within several generations of their life cycle. In summary, lots of unwanted stuff is left in test tubes nowadays directed for NGS sequencing.
Once the prepared sample DNA (be it isolated, fragmented, end-repaired or even RNA being isolated and reverse-transcribed, amplified, fragmented and end-repaired) is bound onto the polymer beads and subject to emulsion PCR (emPCR) amplification there is even less possibilities to do any cleanup. Even repeated small fragment removing procedures leave in the tube residual amounts of oligonucleotide primers. A lot a of previously used enzyme molecules are stilll bound to their substrate DNA at this stage and there is no way to remove them properly. We just have to admit residual activities are left in the tube and will interfere with our next steps, with our goal to do meaningful sequencing.
Current issues
Although there are some ways to quantify functional emPCR products a broader quality control procedure is still missing. Clearly, while many beads have some DNA attached we don’t know the details. Further, we know that at the best not every bead carries a population of clones which are functional (can be amplified). So at this step we don’t know what we have in the test tube. Finally, we throw this complex mixture (the beads with whatever is bound to them and whatever else is floating in the solution) into the sequencer and surprisingly sometimes we get shorter reads (conflicting with size distribution of our measured initial DNA inserts), we received less reads, we yield lower base quality than we hoped for. Those are just numbers and with some alteration to software parameters one could get higher numbers. But who needs more junk reads, who needs reads with longer sequence if the gain includes junk way too low-quality sequence? Most importantly, sometimes the reads do not assemble together … and we just don’t know what went wrong. Is that a bad flanking sequence preventing the assembly? Is that caused by overall bad sequencing machine performance? Is that a lab issue? Sequencing seems like a black box but finally, it is possible to learn something from the past results.
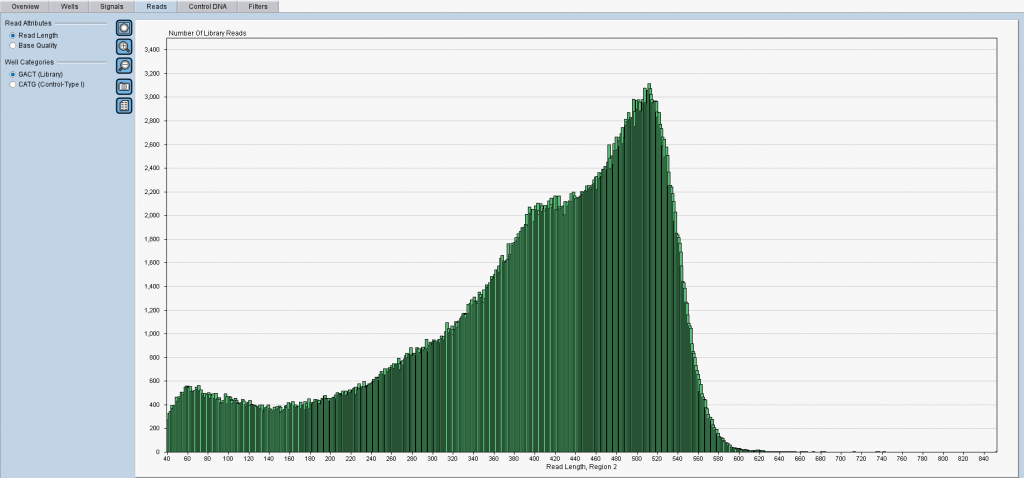
Figure 1: An overview of read lengths (X-axis) as reported by the software from Roche. Y-axis shows incidence counts. Notably, one cannot separate the reads into groups to track which population of samples or sample fragments was sequenced badly (or amplified badly?). 😉
Aren’t you satisfied with the above figure with all reads in green color? Do you wonder why there were short reads with lengths under 100nt at all? So you reached the right place now! If you have Roche 454-based data we can help you.
Fixing your input data without modifiying your own data flow
Bioinformatics.cz can analyze your sequencing reads, clean them up, we can tell you what went wrong and we can discuss how you could avoid that in future. Where did we get our confidence? From inspecting over 1500 independent sequencing runs from the public short read databases. Look at the improved trimmed read lengths (in orange color) on our main web page. One can fix the raw reads in the SFF/FATQ/FASTA files so these can be used for your latter work. Interestingly, there are datasets where almost all sequencing data proved to be just useless crap but thanks to our software one can get an answer why was it so. In brief detail, sometimes due to unremoved adapters, sometimes due to other artifacts due to lab protocol or lab workers …. In many sequencing forums on the internet people tend to refer to failed runs … but not always the reason for a failure was the sequencing device or chemicals.
Over 35 laboratory protocols suppported
People are modifying protocols, start with a material in a different state than requested, sometimes they omit certain cleanup steps to avoid additional losses of the sample, sometimes they likely forgot what they already did. There are cases where clearly, sample was impure or contained shorter fragments than was expected … and the sequencing results just reflected that. So in summary, not always is the machine vendor to blame. And the good news is that one can trace that all backwards thanks to our analytical software!
[carousel source=”media: 852,853,850″ width=”900″ width=”1600″ height=”300″ items=”1″ title=”no” arrows=”no”]
Figure 2: Precise detection of adapters, MIDs, artifacts and of their obfuscated variants provides basics for very in depth inspection of the data, evaluation of laboratory protocol used to prepare the sample for sequencing and to rate quality of the sequencing itself. Analysis performed and figures generated by bioinformatics.cz software (unpublished).
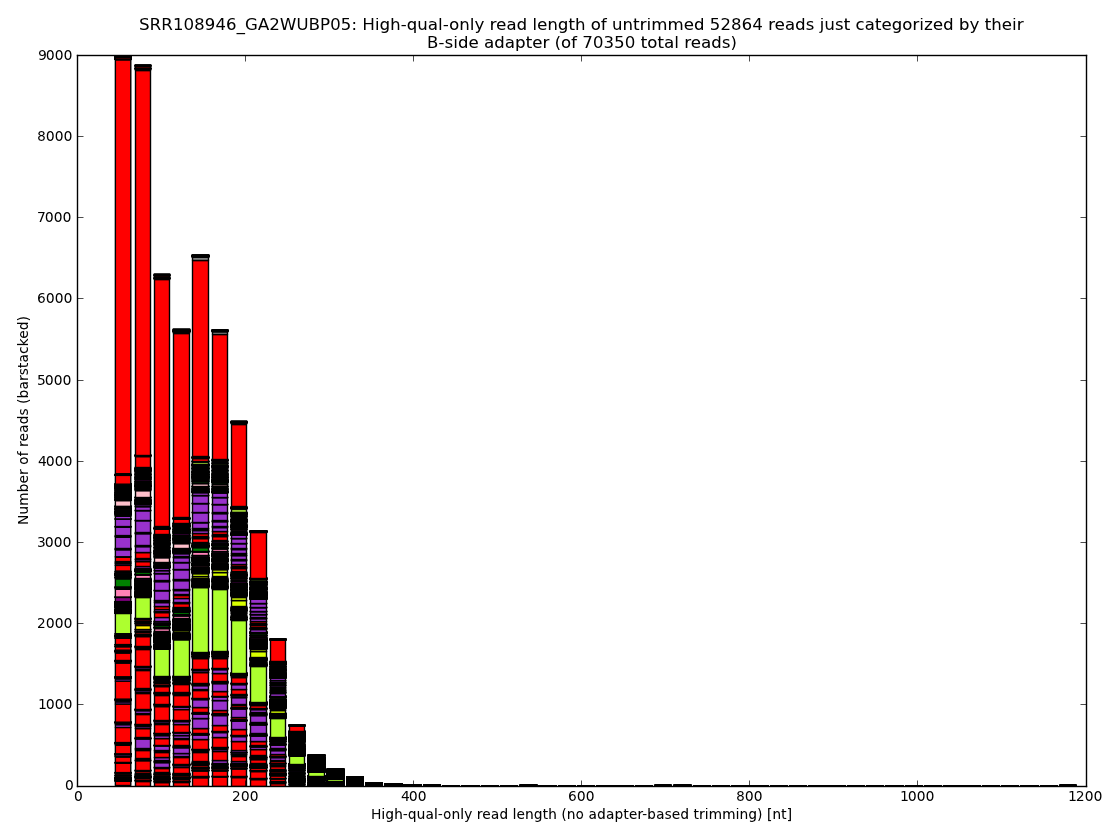
Figure 3: Proper removal of adapters and of other errors in every raw read dataset results in lots of reads being discarded or at the best in significant losses during trimming. The usual ratings of nucleotides received per dollar are often misleading because they typically ignore such waste. The sequencing approach, MID sample tags and most importantly, the sample preparation protocol, have by far the largest impact on the final outcome. Analysis performed and figures generated by bioinformatics.cz software (unpublished).
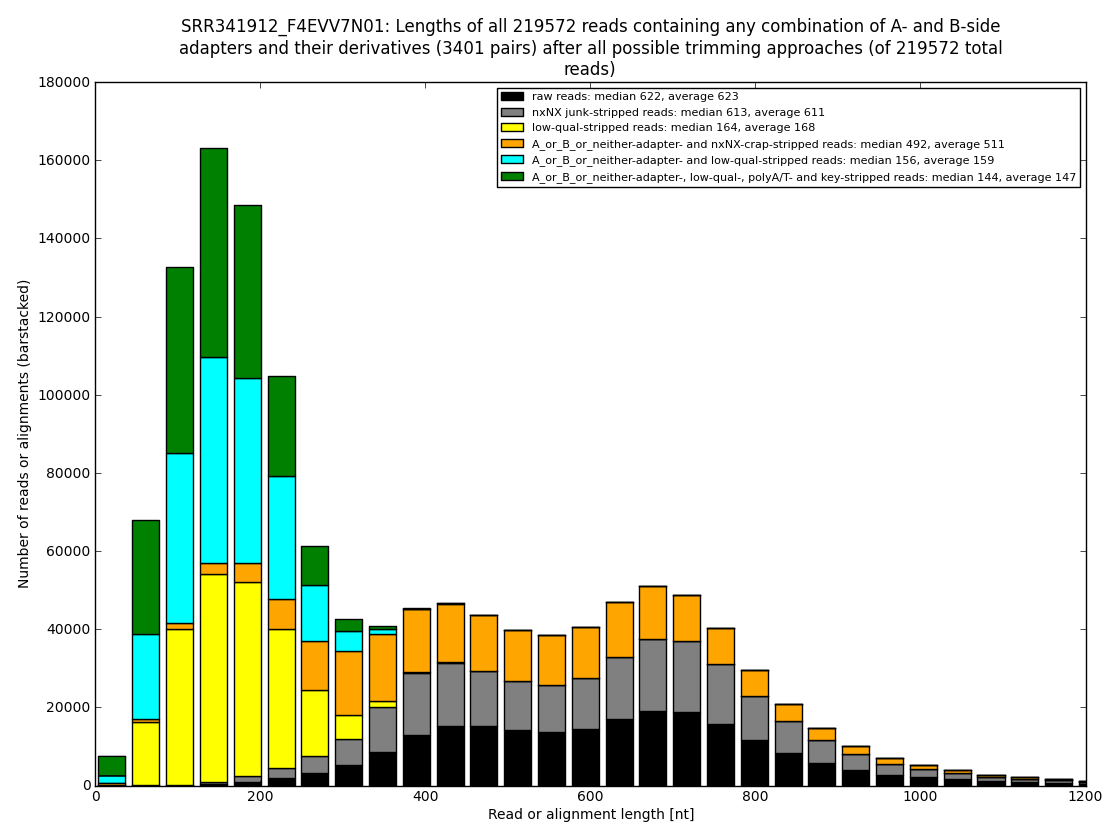
Figure 4: In some datasets one could show how many usable nucleotides are likely hidden in the so called “low-qual” region, which is officially not to be used but some assembler programs dive into the gray area to merge more reads together into longer contigs. And that makes sense. From our experience one can rescue even 250nt of quite usable sequence (usually about 80-160nt). Analysis performed and figures generated by bioinformatics.cz software (unpublished).
[carousel source=”media: 1057,1058,1059″ width=”1600″ height=”300″ items=”1″ title=”no” arrows=”no”]
In summary, we can fix your raw reads, we can trim them precisely, we can extend usable read length, we can evaluate your experimental design, performance, propose improvements, evaluate sequencing instrument and basecalling quality, and much more. There is just no other company offering anything like this! Not even 1%.